ABC analysis: A tool for inventory optimization


The aim of inventory analysis is to identify problems in inventory management and to direct the inventory management towards further optimization. The analysis determines, for example, what the structure of the inventory is or whether the size of the inventory held is appropriate for the turnover of goods.
Several methods can be used to analyse your inventory. In the common literature you will come across ABC analysis, XYZ analysis, or multi-stage and multi-criteria analyses.
For today’s article, we have chosen the most common method – ABC analysis. How to work with this analysis? How can it contribute to more effective management of your business?
Inventory analysis
If you decide to analyze your inventory, the first and most basic step is to select the criteria to be monitored. The most common criteria include, for example, the quantitative and structural development of inventory over time, the development of turnover at the product level, the absolute number of sales of specific products, the share of individual products in total sales, seasonality, demand forecasts, expiry dates, delivery times and supplier reliability, storage requirements, etc.
However, the process does not end with the analysis. The entrepreneur has to look further into the reasons why the desired ratio in storage of each product is not achieved. The ultimate goal is therefore to achieve an ideal ratio of stock development to sales. Only in this way you can eliminate the risk of out-of-stocks and achieve optimal inventory management.
What is ABC analysis
ABC analysis is one of the methods of analyzing inventory consisting of classifying products into three groups. It aims to identify the products that are essential to the overall business result – the products that bring in the most and the least money. The grouping looks as follows:
- Group A = products that are vital to the business, specific to the business, with a low number in stock but a key contribution to total revenue.
- Group B = complementary products, which are more abundant in stock compared to Group A, but contribute less to revenue.
- Group C = so-called long-lasting products, which are characterised by high storage requirements but little demand from end customers.
TIP: Group D is also sometimes used in logistics, which includes products that have been in stock for more than 1 year.
The following table can be used as a guide to categorise and prioritise products into different groups. From the figures in the table, it is clear that the ABC analysis is based on the Pareto rule, where e.g. 20% of stock items contribute to 80% of total turnover / total sales volume / total stock value, etc.
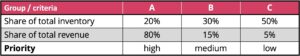
Table 1: Indicative thresholds for dividing products into groups A, B, C
TIP: The use of the Pareto rule can be applied across departments in e-commerce, let’s take an example from marketing. Divide your customers into groups and see which 20% of your customers bring you 80% of the profit.
Grouping tends to be highly subjective, in some cases only one product may be part of a group.
How to do ABC analysis
If you decide to analyse your inventory using the ABC method, we recommend the following procedure:
1. Setting up an inventory table of individual products.
2. Arrange the table in descending order (e.g. by best-selling products, most expensive products, etc.).
3. Calculate cumulative values of individual products.
4. Calculate cumulative values as a % of total value (e.g. total sales, total costs, etc.).
5. Draw a Pareto diagram.
6. Divide the items into groups A, B, C.
We are going to illustrate the process step by step using a concrete example in which we use the amount of revenue of 15 product types as a criterion.
Setting up an inventory table of individual products
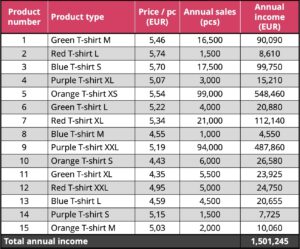
Table 2: Setting up an inventory table of each product
Arrangement of the table in descending order of the products generating the highest income, calculation of cumulative values and calculation of cumulative values as % of total value
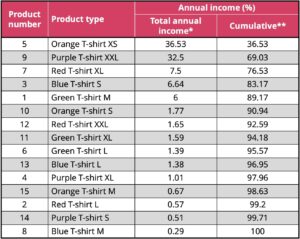
Table 3: Arrangement of the table in descending order of the products with the highest income, including cumulative (%)
* Individual values are calculated from the data in Table 2; example Orange XS shirt = (90,090 /1,501,245) * 100
** The individual values are the sum of the previous cumulative result and the total annual income of the following product; example for purple T-shirt XXL = 36.53 + 32.5
Drawing a Pareto diagram
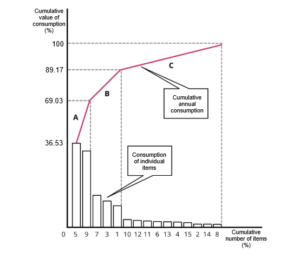
Grouping of items into groups A, B, C
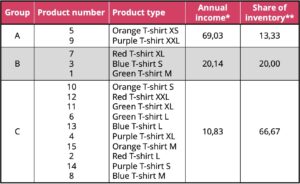
Table 4: Breakdown of items into groups A, B, C
* This is the sum of the revenue of all products that are part of a given product group
** This is the proportion of all products in a particular group in the total inventory
The table shows that Group A products represent the highest income (69.03%) and 13.33% of all stocks. Products belonging to Group B represent 20.14% of the total annual income and 20% of the stock. Group C products represent only 10.83% of the total annual income but account for 66.67% of the total stock.
How to work with each product group
In practice, we can sometimes encounter a flat stock handling approach with individual products or consistent replenishment from suppliers – regardless of grouping.
However, this approach is wasteful. It is important to work with each product group in a different way, otherwise you will not avoid overstocking or unnecessary overwork with less marketable / currently unsaleable products. Consequently, you will incur higher acquisition costs as well as costs for storage, related equipment or service personnel. It is for these reasons that we highly recommend working with inventory analysis.
“ABC inventory analysis is an optional part of our service. According to the results of the analysis, we also work with client’s products, for example, in the warehousing, where Group A products are primarily stored in shelves, which are used for immediate picking of products for incoming orders. In addition, we store the best-selling products in the immediate area near the packing tables to further improve the time efficiency of picking. Group C products, on the other hand, are primarily stored on pallet racks where they “wait” for their selling season. In this way, we also reduce storage costs for our clients,” Rostislav Matějka, MLog., Logistics Engineer at Skladon.
We recommend working with each product group according to the following rules:
Group A
- Order fixed batches based on monitoring
- Order at high frequency in small batches
- Adapt to optimal re-order quantity
- Keep safety stocks low
- Regularly evaluate the demand forecasting
Group B
- Order batches up to a specified maximum quantity level
- Order at medium frequency for larger batches
- Monitor stock levels at regular intervals
- Hold higher safety stocks
Group C
- Order at low frequency in large batches
- Periodic stock checking
- Maintain a relatively high safety stock
We illustrate these differences in inventory management by product group once again in the following table:
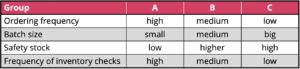
Table 5: Differences in inventory management by product group
If you follow the above rules, you will encounter higher acquisition costs for Group A products, but you will reduce their average inventory. The opposite effect is achieved for Group C products.
“At Skladon, we only pay for the storage space we actually use. If you have a well set up warehouse management and keep an eye on a turnover of goods, you can save tens of thousands of Czech crowns per month,” Lucie Konecna, COO nanoSPACE.
Skladon: The technology partner for your logistics
Inventory analysis has a direct impact on both your logistics costs and the speed of order processing. The sooner you incorporate this methodology into your inventory management, the faster you can capture the flow of your products, leading to a higher level of customer experience.
Or join forces with us – we already work with the methodologies mentioned above. For this purpose, we have also developed the MySkladon application, which offers our clients a complete overview of their logistics, including the current stock status. The application offers advanced reporting options, which can be used to plan the ordering of goods from your suppliers and thus optimise your inventory management.
We will then arrange the rest. We will store your products in economically suitable shelves, set up warehouse processes according to your wishes and add our know-how. The result will be accurate order processing and fast delivery into the hands of your end customers. In other words, with us you will achieve a superior logistics level that will set you apart from your competitors in your industry.